
Molecular and in vivo imaging, immediate-early genes, cognitive coordination and psychosis
Using IEG technique we can monitor neuronal activity and synaptic plasticity.
IEG expression is triggered in neurons after patterned activity in a molecular cascade leading from neuronal activity to synaptic plasticity. It is used to map neural circuit activity patterns, although they may actually correspond to the amount of elicited plasticity. Arc/Homer1a catFISH (Figures 1,2) uses expression of IEGs Arc and Homer 1a to map activated neuronal ensembles during two distinct behavioral episodes and allows the effect of changes in an environment on ensemble activity patterns of the same neurons. For example, activated ensembles are more similar after exploration of the same environment (A-A) than after exploration of distinct environments (A-B). Our data show that this contextual specificity is disrupted after systemic administration of psychotomimetic dizocilpine (MK-801) at a dose of 0.15 mg/kg whereas lower dose (0.10 mg/kg) had no effect (Figure 3). Both doses generally reduced IEG expression, but only the higher dose increased similarity between ensembles expressing IEGs after exploration of two different environments A (circular arena) and B (square open-field in a different room). The same dose (0.15 mg/kg), but not 0.10 mg/kg, also disrupted spatial coordination on a rotating arena (Carousel) in the presence of irrelevant information (Figure 4).
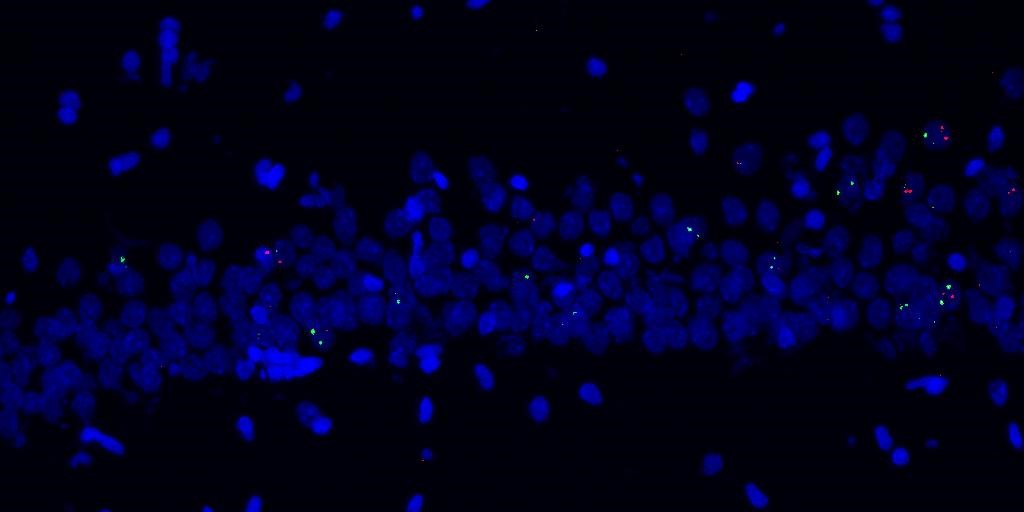
Figure 1. Fluorescence in situ hybridization from dorsal CA1. Magenta dots represent intranuclear foci of Arc expression and Homer 1a is in green. Nuclei are counterstained with DAPI.
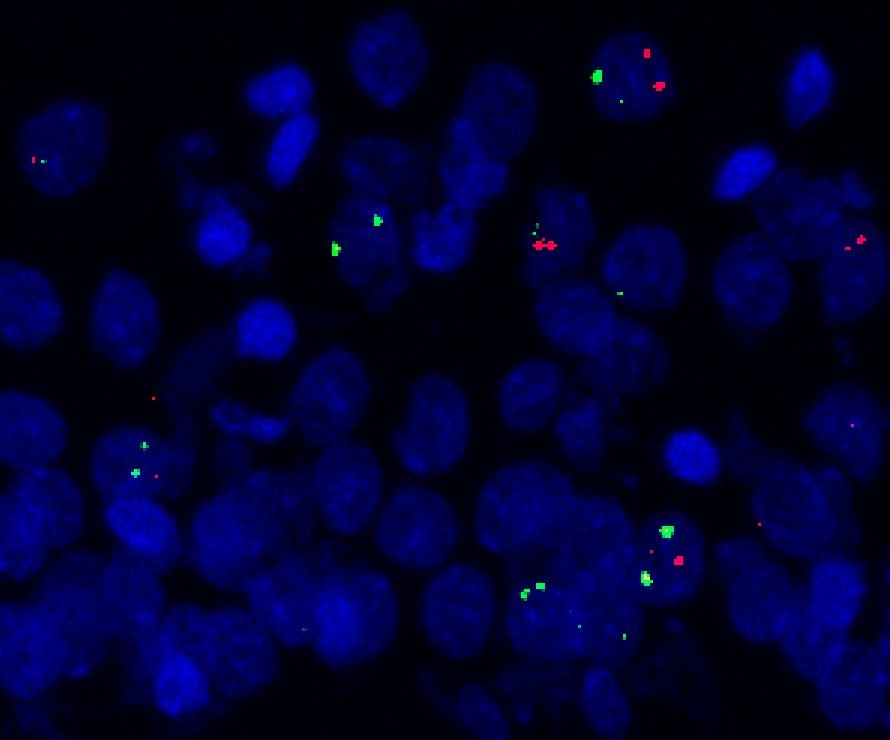
Figure 2. Detail from Fig. 1. Nuclei of pyramidal cells differ in their size, shape, structure and staining intensity. Neuronal nuclei separate into 4 categories: negative (-), Homer1a+, Arc+ a double+
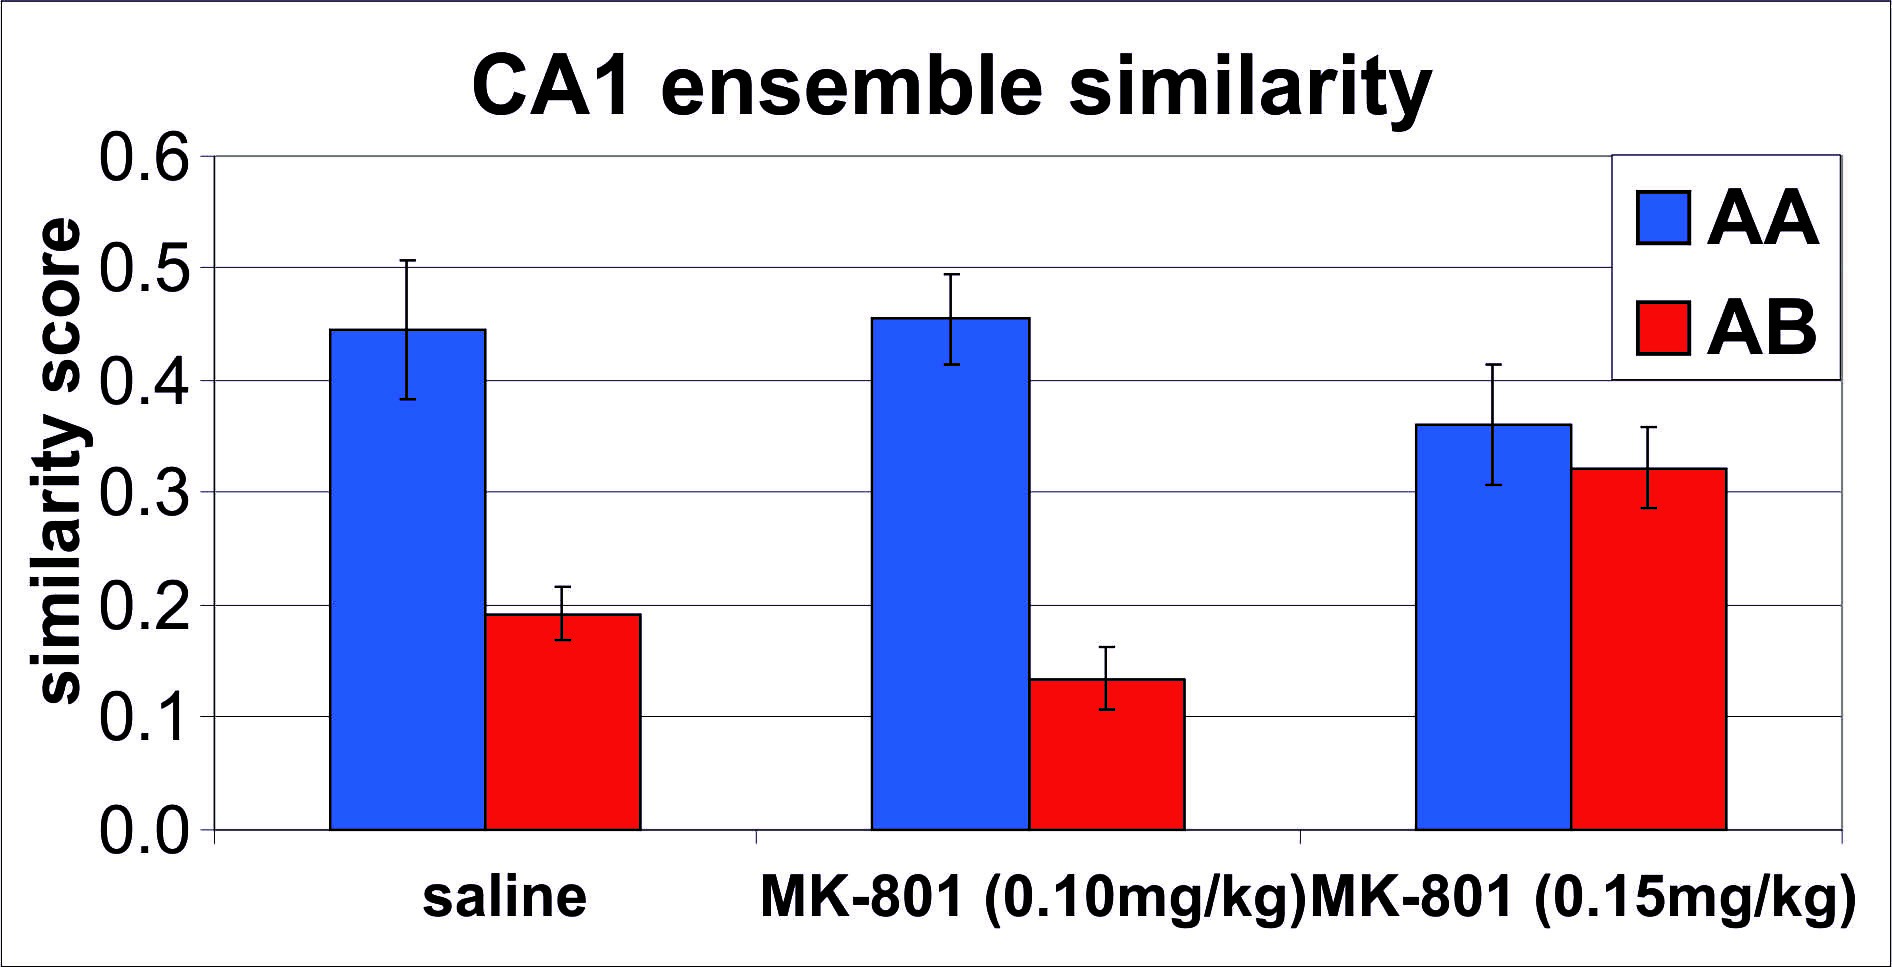
Figure 3. Higher dose of MK-801 increased similarity between CA1 ensembles expressing IEGs Arc a Homer 1a in distinct environments A and B and eliminated the contextual specificity of IEG expression. The similarity score is defined as a ratio of difference diff(E1E2) between observed (Arc&Homer1a)+ and expected (chance) overlap p(E1E2) of both activated ensembles and difference between smaller of both (Arc+ or Homer 1a+) and their expected (chance) overlap p(E1E2). Similarity score = diff(E1E2)/(least epoch - p(E1E2), where E1 a E2 are proportions of Homer 1a+ Arc+ neurons, respectively, and p(E1E2) is their product E1*E2.
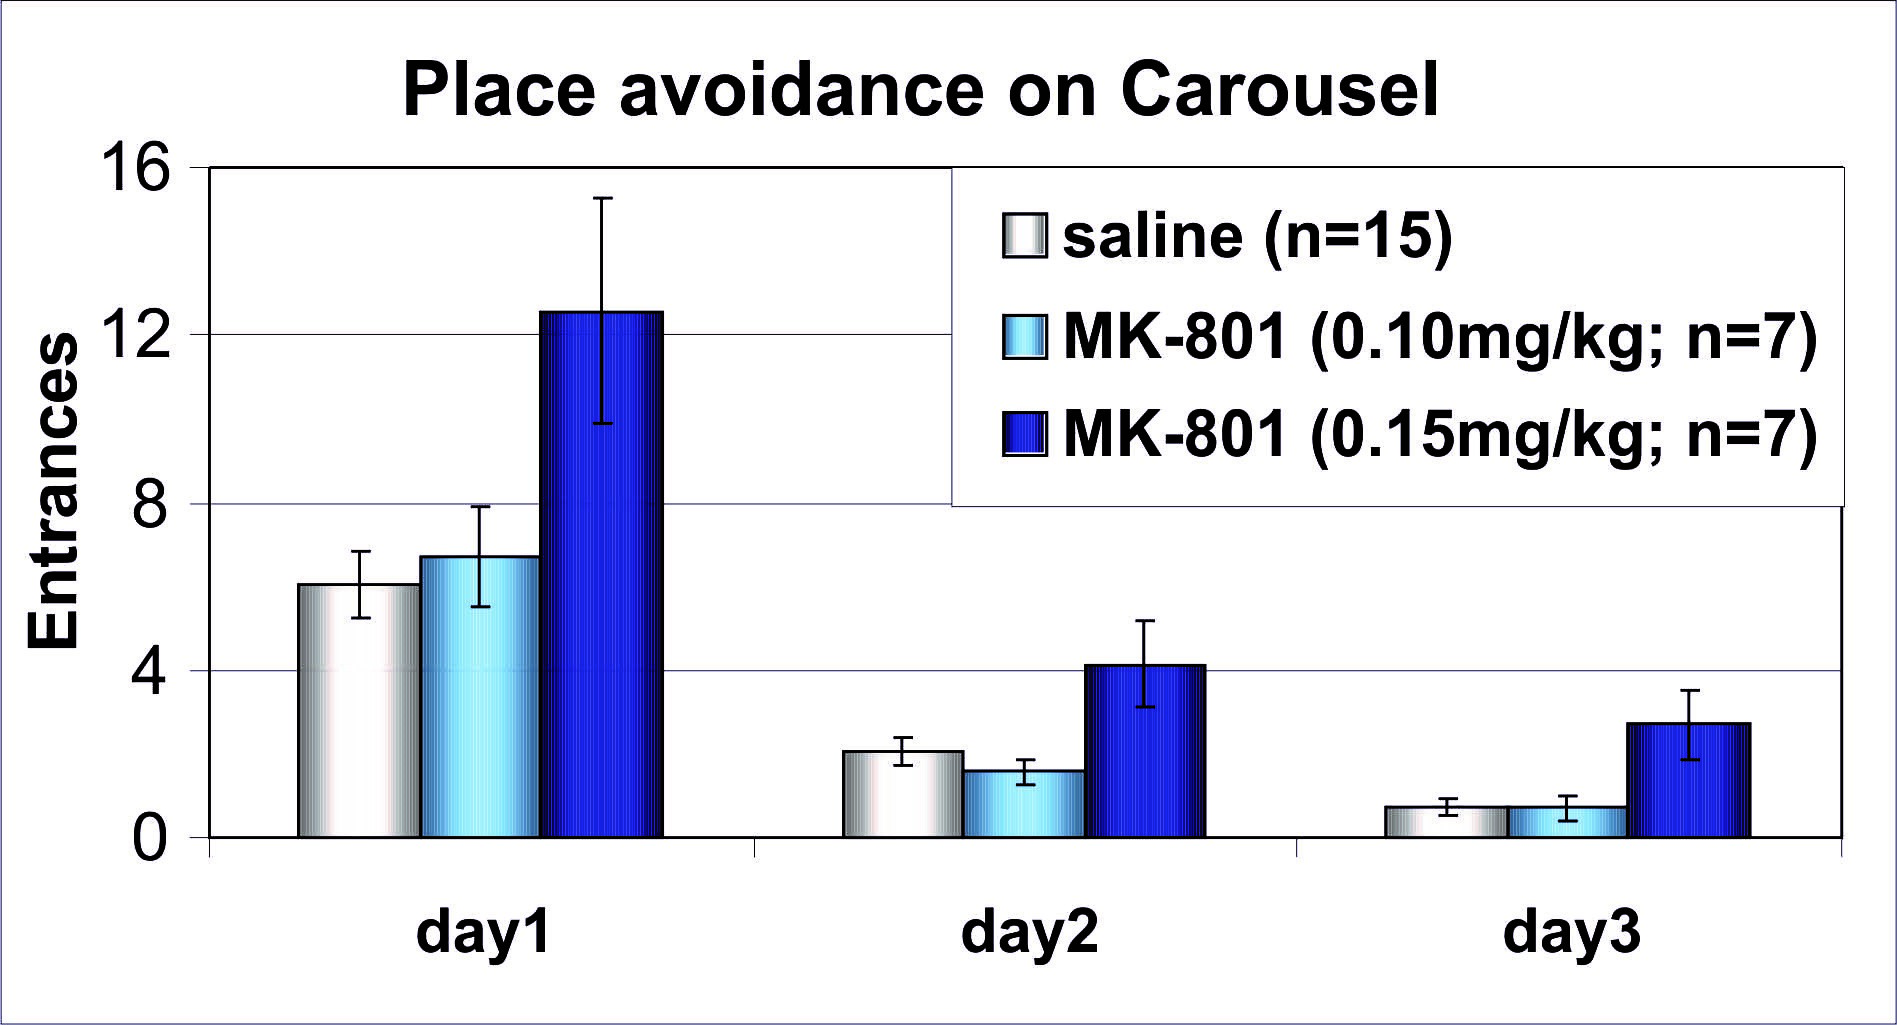
Figure 4. Higher dose of MK-801 also disrupted spatial coordination on a rotating arena (Carousel) in the presence of irrelevant information.
Increased similarity between hippocampal representations may reflect increased coactivity of previously unrelated neurons (ensembles) - hypersynchrony (Fenton, 2009). Resulting decreased contextual specificity of mnemonic representations of behavioral episodes may be responsible for psychotic cognitive disorganization.