Metabolomics, lipidomics and fluxomics
| Software: |  GTTAtlas GTTAtlas |
 MetaboAtlas21 MetaboAtlas21 |
 LORA LORA |
Methodological highlighs from publications using small molecule omics techniques.
GTTAtlas
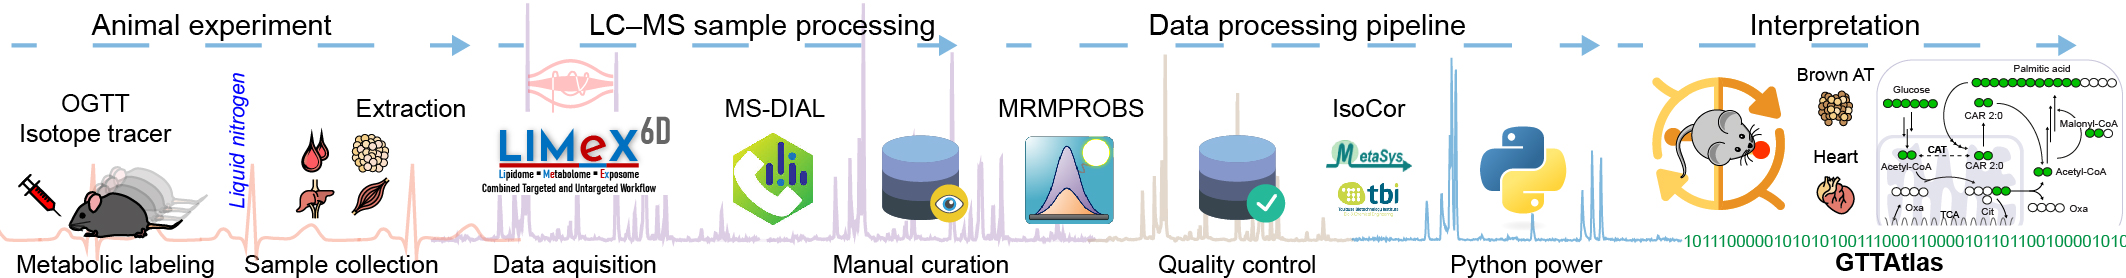
Metabolomics atlas of mouse tissue during oral glucose tolerance test using [13C6]-glucose as a tracer.
- Interactive metabolomics and lipidomics atlas of polar and non-polar metabolites.
- Standard oral glucose tolerance test (OGTT) with [13C6]-glucose was performed.
- Twelve metabolically-relevant mouse organs and plasma were collected at specific time points during the OGTT.
- Six-dimensional metabolipidomic LC-MS platform was used to analyze samples.
- High resolution accurate mass spectrometry was used to detect metabolite isotopologues labeled with 13C.
- Metabolic pathways were used to explore the fate of 13C-labeled glucose.
- Inter-organ metabolism of glucose and its metabolites was evaluated.
- Software for metabolic pathway mapping: Mapper - a pathway mapping tool.
► Magno Lopes, Kristyna Brejchova, Martin Riecan, Michaela Novakova, Martin Rossmeisl, Tomas Cajka, Ondrej Kuda✉
Metabolomics atlas of oral 13C-glucose tolerance test in mice
Cell Reports, 2021, 27 (2), 109833 DOI https://doi.org/10.1016/j.celrep.2021.109833
- A systems-level organ-specific metabolomics atlas of mouse tissues
- 13C6-glucose tracer tissue distribution during glucose tolerance test
- Interactive online application for metabolic pathway exploration
- LC-MS data resource covering polar metabolites and complex lipids
MetaboAtlas21
MetaboAtlas21 is a comprehensive atlas of the mouse metabolome and lipidome.
- In collaboration with Laboratory of Metabolomics.
- Interactive metabolomics and lipidomics atlas of polar and non-polar metabolites.
- Twenty one mouse organs and biofluids & two diets & three reference serum/plasma samples were analyzed.
- Seven/eight-dimensional metabolipidomic LC-MS platform was used to analyze samples.
- Computational resources were supplied by the project "e-Infrastruktura CZ" (e-INFRA LM2018140) provided within the program Projects of Large Research, Development and Innovations Infrastructures.
 Mapper - a pathway mapping tool
- Online metabolite mapping tool.
- Use an excel file to map metabolite concentration on a metabolic pathway map.
- Supports simple bar graphs and stacked bar graphs for isotopologues.
 Metabolic network viewer
- Online metabolic network (biochemical reaction network) visualization tool.
- Supports 13C-based models and elementary metabolite unit (EMU) notation 'A (abc) -> B (ab) + C (c)'.
- Compatible with models for the MFA Suite™ (Metabolic Flux Analysis Suite) https://mfa.vueinnovations.com/.
LORA
- Online Lipid Over-Representation Analysis tool.
- Built on Goslin grammars, supports multiple lipid annotation dialects.
- Uses UpSet plot, circular hierarchical tree and Cytoscape network to describe lipidome data enrichment.
► Michaela Vondrackova, Dominik Kopczynski, Nils Hoffmann, Ondrej Kuda✉
LORA, Lipid Over-Representation Analysis Based on Structural Information
Analytical Chemistry, 2023 DOI https://doi.org/10.1021/acs.analchem.3c02039
- Web application LORA.metabolomics.fgu.cas.cz
- GIT https://github.com/IPHYS-Bioinformatics/LORA
Dynamic metabolomics - tracing 13C glucose
5-PAHSA primes adipocytes for glucose metabolism in a different way from insulin. 5-PAHSA partially re-wires glucose metabolism pathways in favor of Krebs cycle, NADPH synthesis and de novo lipogenesis. Simplified metabolic situation is animated through the pathway within 15 minutes of glucose uptake into adipocytes. Details and conditions in Paluchova et al. DOI and FAHFA page
Use of [4-2H]-glucose for metabolic labeling of NADPH.
[4-2H]-glucose can be used as a malic enzyme tracer, which specifically labels NADPH’s redox active hydrogen. The deuteron from [4-2H]-glucose is passed to NAD2H by glyceraldehyde 3-phosphate dehydrogenase (GAPDH) during glycolysis. This cytosolic NAD2H can be used by cytosolic malate dehydrogenase 1 (MDH) to convert cytosolic oxaloacetate (coming from citrate cleavage by ATP citrate lyase) to cytosolic [2-2H]-malate. This deuterated malate can be either transported to mitochondria or converted by malic enzyme 1 (ME1) to cytosolic pyruvate and cytosolic NADP2H. This NADP2H represents the energy for DNL. During the synthesis of a fatty acid from acetyl-CoA units (via malonyl-CoA), two NADPH molecules are used per one C2 unit. The fatty acid labeling is the result of two stochastic hydrogen selection processes, with 1/3 of hydrogens coming from water and 2/3 coming from NADPH. If cytosolic NADP2H is present, contribution of malic enzyme 1 NADPH to fatty acid synthesis can be measured.
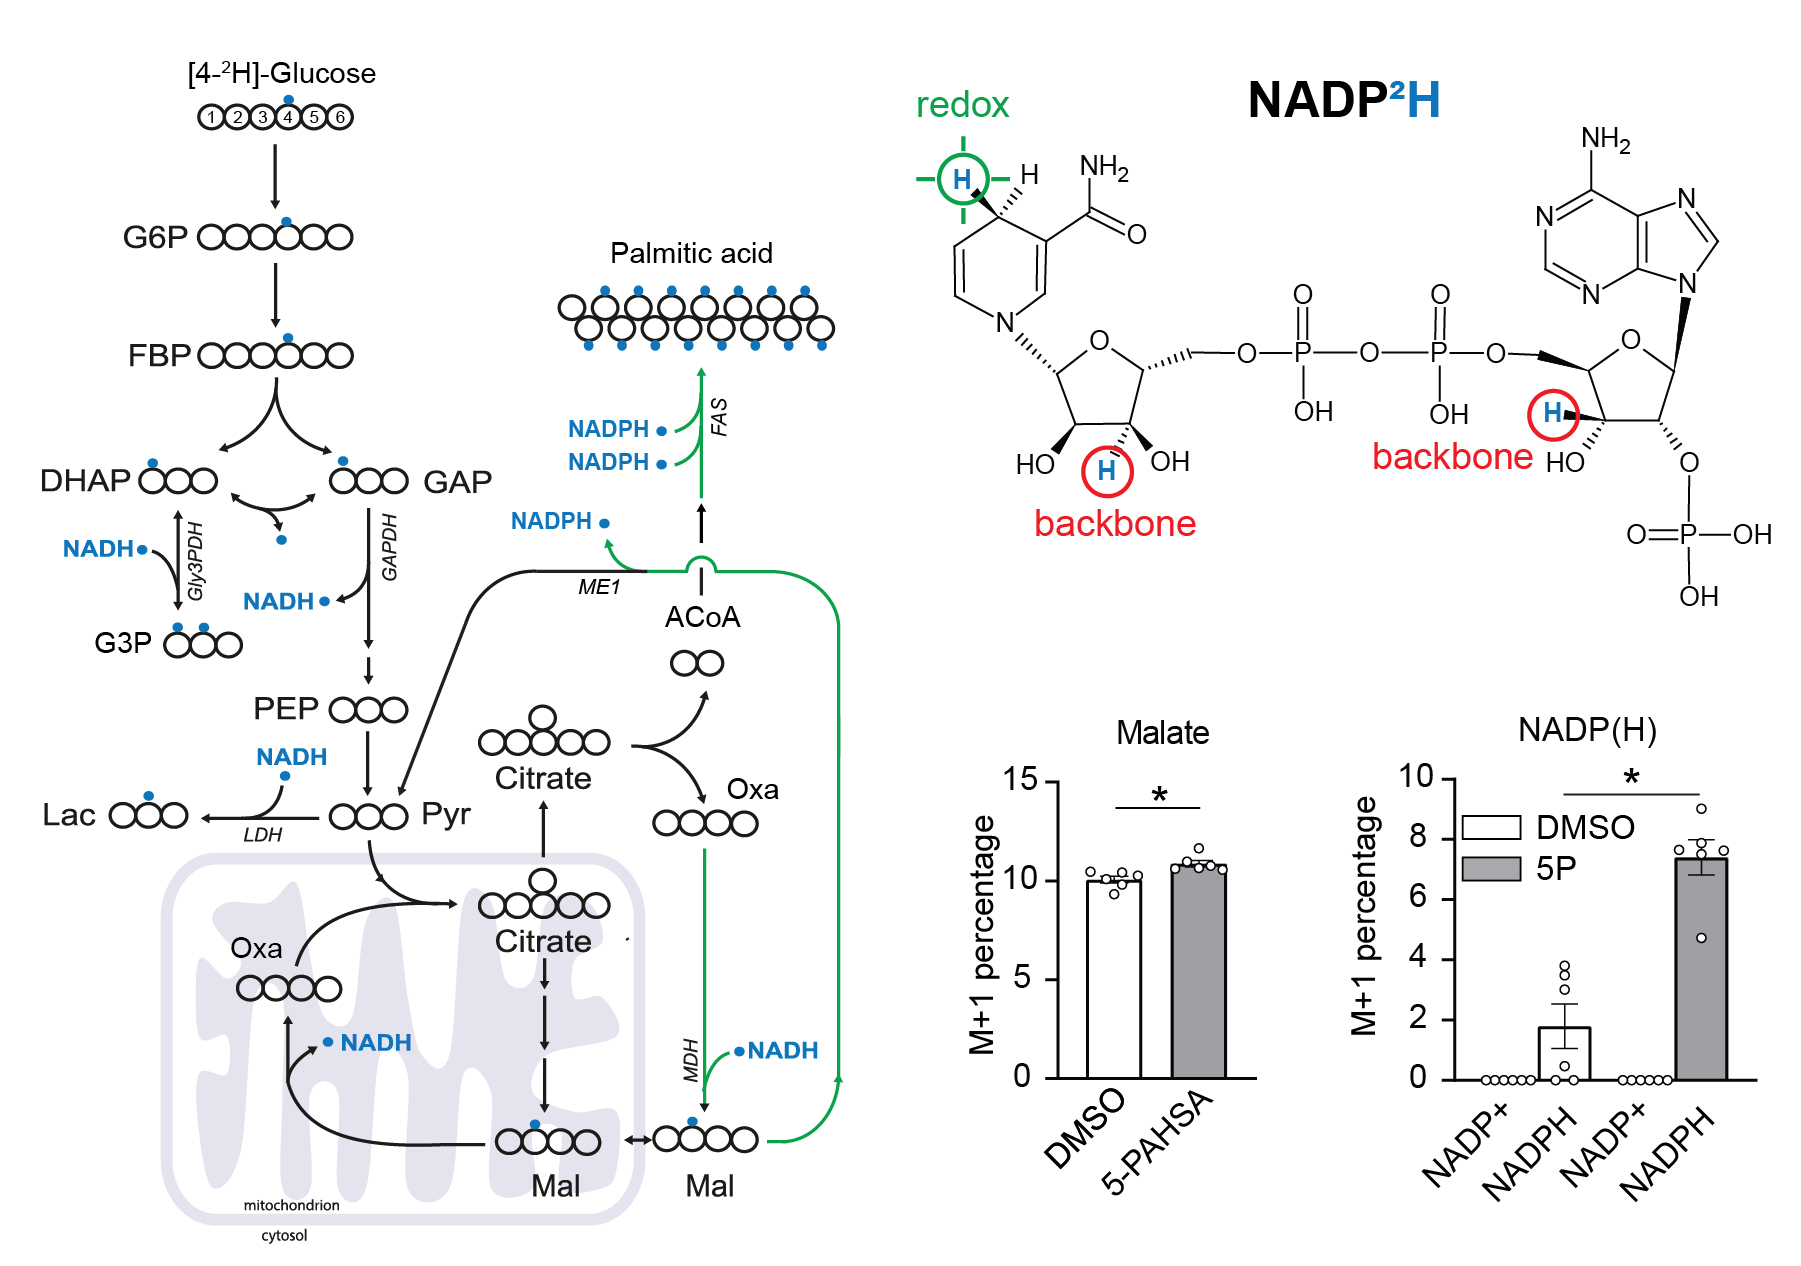
3T3-L1 differentiated adipocytes were incubated with or without 40 µM 5-PAHSA in medium with [4-2H]-glucose for 24 hours without insulin, metabolism quenched on liquid nitrogen, cells extracted to preserve NADPH and NADP+ ratio, and raw extracts immediately measured by LC-MS/MS according to a published protocol.
Malate labeling M+1 documents that the deuteron was introduced by labeled NADH. For further details regarding malate labeling and its alternative fate see ref. Lewis et al. NADPH M+1 over NAPD+ M+1 labeling represent the redox-active deuteron on NADP2H. 5-PAHSA treatment resulted in significantly higher labeling of cytosolic NADPH. For more details see ref. Lie et al. Scheme adapted from Lewis et al.. Data from this labeling experiments were adjusted for C, H, O, N, P natural abundance and tracer purity using IsoCor-2.0.5. Details and conditions in Paluchova et al. DOI and FAHFA page
Lipid labeling using 2H2O - labeling of neutral lipids
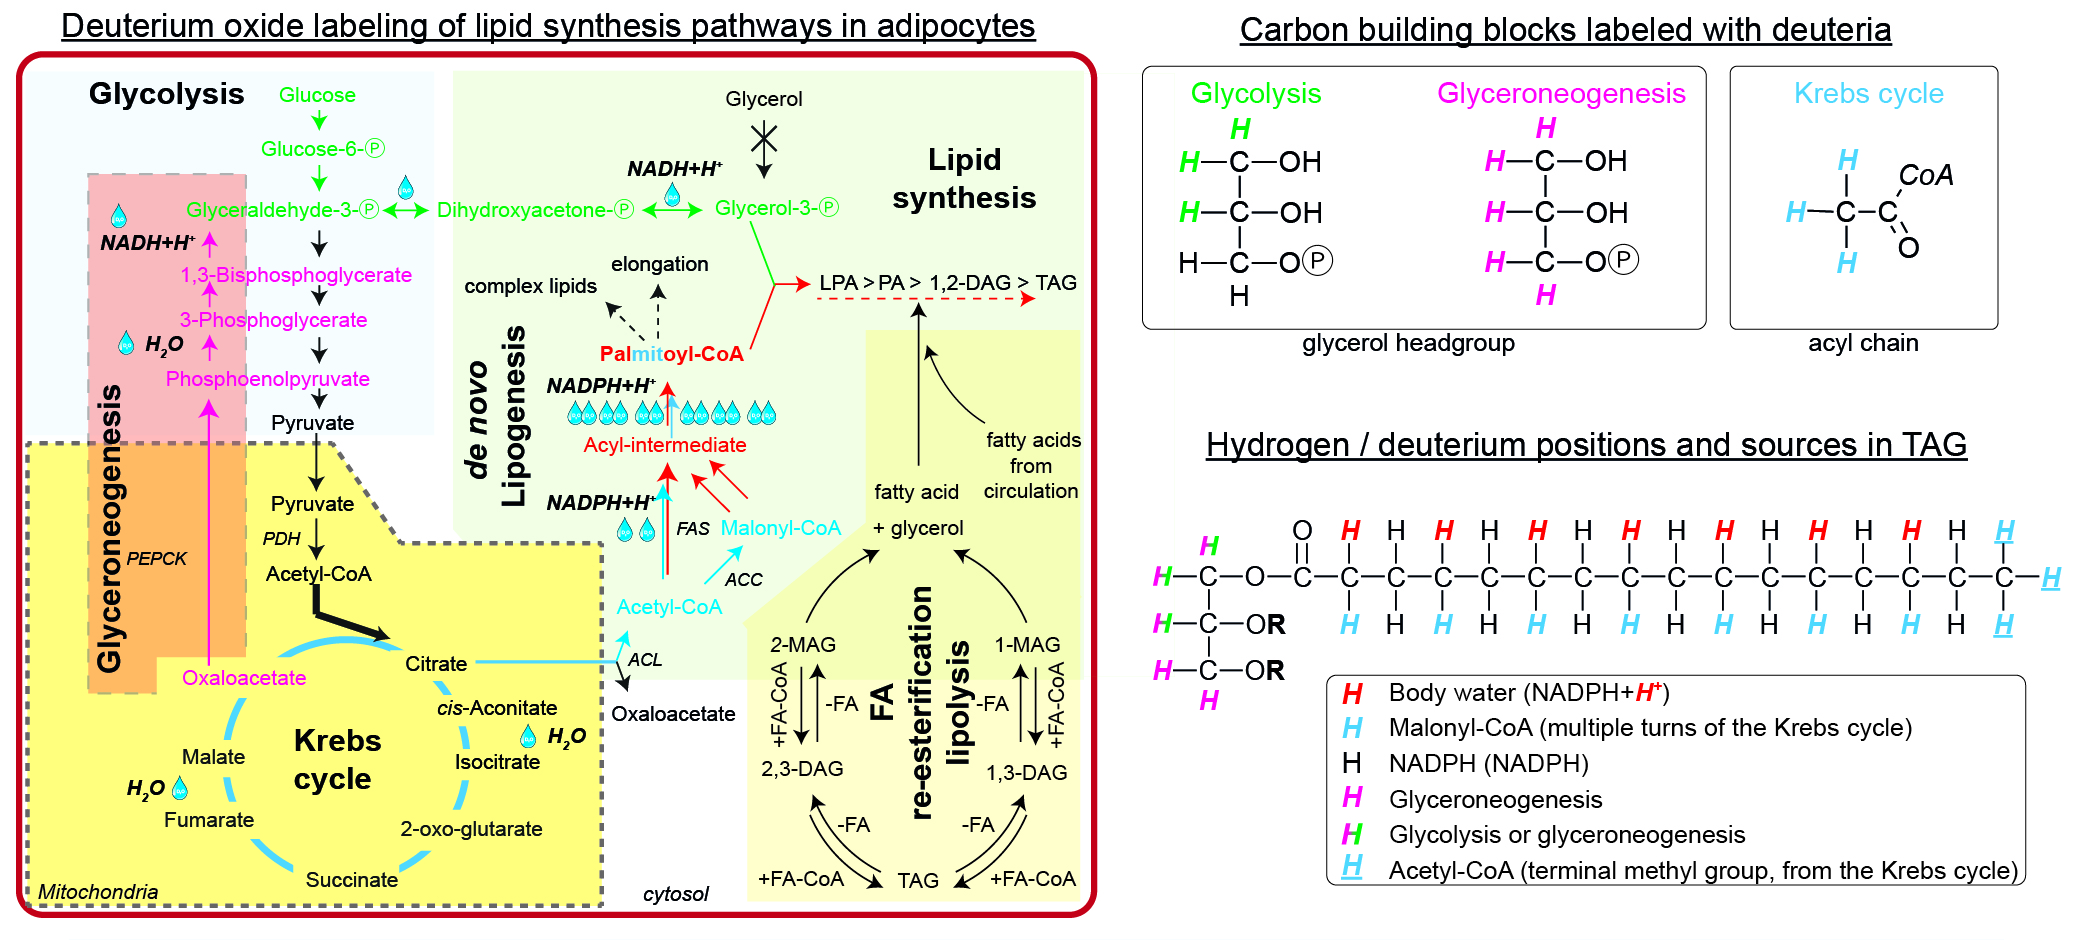
For the simple synthesis of TAGs, glycerol phosphate and acyl-CoAs are needed. WAT is virtually lacking glycerol kinase, thus all glycerol phosphate has to be synthesized either via glycolysis (green path) or glyceroneogenesis (pink path). During glycolysis, deuteria (up to 3, M+3) could be incorporated from water within the equilibrium between Glyceraldehyde-Ⓟ, Dihydroxyacetone-Ⓟ, and Glycerol-3-Ⓟ. The alternative glyceroneogenic pathway precursors are deuterium-labeled within the Krebs cycle and further during conversion of Phosphoenolpyruvate to Glyceraldehyde-Ⓟ. This path may incorporate up to 5 deuteria per glycerol after several turns of the Krebs cycle. The intermediates labeled with deuteria within the Krebs cycle may also enter the de novo lipogenic pathway (blue path) as labeled Acetyl-CoA. The first (and future terminal methyl group) Acetyl-CoA keeps the deuteria, while the later Acetyl-CoAs are converted to Malonyl-CoAs and lose one deuteria from the Krebs cycle. During the elongation process of the acyl-intermediate, NADPH+H+ provides additional deuteria equilibrated from body water, thus potentially increasing the enrichment (red path). Finally, both glycerol phosphate and newly synthesized palmitate can form TAG. The degree of enrichment of the final TAG might be diluted by the contribution of FA re-esterification / lipolysis or import of external fatty acids. There are up to 6 metabolically different hydrogens, which could be exchanged for deuterium in a simple TAG.
Literature:
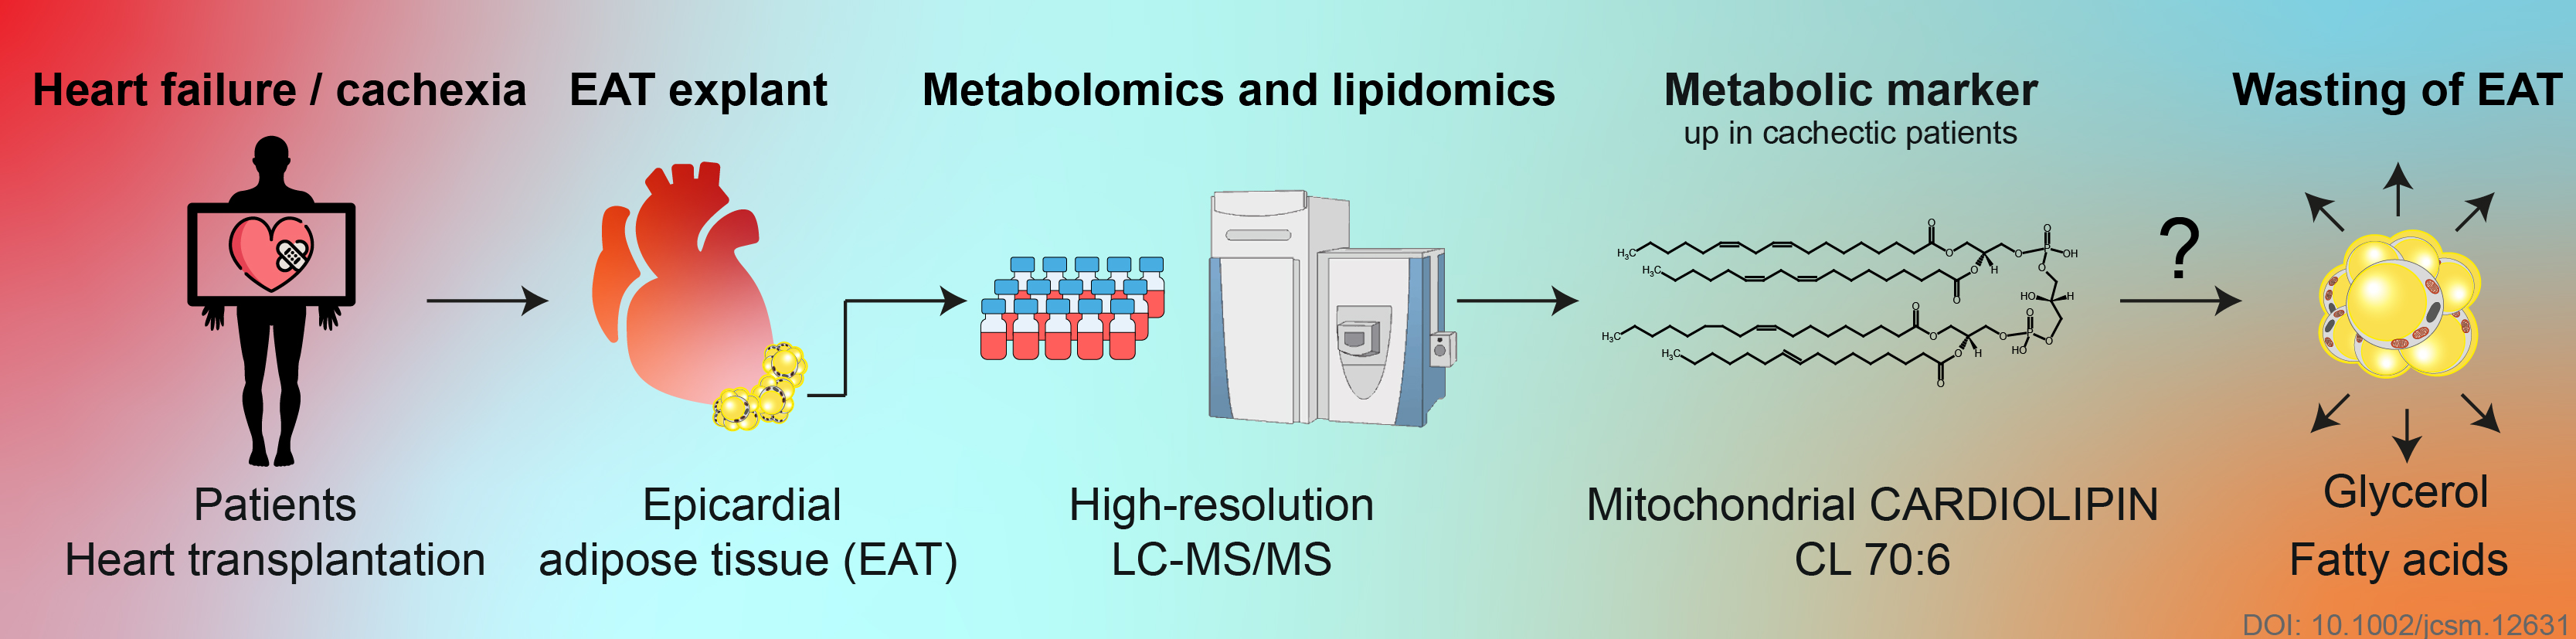
► Petra Janovska, Vojtech Melenovsky, Michaela Svobodova, Tereza Havlenova, Helena Kratochvilova, Martin Haluzik, Eva Hoskova, Terezie Pelikanova, Josef Kautzner, Luca Monzo, Ivana Jurcova, Katerina Adamcova, Lucie Lenkova, Jana Buresova, Martin Rossmeisl, Ondrej Kuda, Tomas Cajka, Jan Kopecky✉
Dysregulation of epicardial adipose tissue in cachexia due to heart failure: the role of natriuretic peptides and cardiolipin
Journal of Cachexia, Sarcopenia and Muscle, 2020, Sep 4, in press DOI https://doi.org/10.1002/jcsm.12631
- Induction of epicardial adipose tissue levels of cardiolipin CL 70:6 could precipitate the wasting of adipose tissue
- BNP signalling probably contributed to changes in epicardial adipose tissue metabolome/lipidome and gene expression in patients with advanced heart failure